
Beneath the headline: what April payrolls actually said
+115k beat consensus, but the body of the report tells a different story. The two BLS surveys disagree, the gain is in two acyclical sectors, and the consumer is leaning on savings and credit.

The Macro Fireside | Friday, May 8, 2026
TL;DR. April nonfarm payrolls printed +115k against a consensus of 65k. The unemployment rate held at 4.3 percent. The tape called it Goldilocks. The body of the report does not. The two BLS surveys disagree sharply this month, the establishment gain is concentrated in two acyclical sectors, the participation rate has fallen to its lowest since October 2021, and the consumer is keeping spending up by drawing down savings and reaching for the credit card. The University of Michigan preliminary May reading out ninety minutes later carried sentiment back to the June 2022 trough with current conditions down nine percent on the month. The case for a Fed cut on this data is not there.
Most of the post‑release commentary I have read this morning has the same shape: better than feared, soft‑landing intact, Fed can stay on hold and stop worrying. One Allianz strategist quoted in the wires said he was “trying to find problems” and could not. I had a different reading.
The two surveys are telling different stories this month. The establishment survey added 115,000 jobs. The household survey, sampled the same month, says employment fell 226,000, the labor force contracted 92,000, the ranks of the unemployed rose 134,000, and 188,000 more people moved into the not‑in‑labor‑force pool. The unemployment rate held at 4.3 percent only because the denominator shrank as fast as the numerator. The two surveys diverge in roughly one month out of three and that alone is not unusual, but the qualitative direction matters: the household read is a soft labor market, and the establishment read is one being held aloft by a narrow set of sectors. February was revised down a further 23,000 to −156k; March was revised up 7,000 to +185k; the net for the two months is 16,000 lower than reported a month ago. The three‑month average sits at +48k for total nonfarm and +55k for private — that is the trend rate.
Composition is doing more work in this print than the level. Health care contributed +37k. Health care plus social assistance combined contributed roughly +54k seasonally adjusted. Private education and health services together added +46k. Transportation and warehousing added +30k, almost all of it couriers and messengers (+38k) — a category I would not lean on too hard given how the Easter calendar fell this year. Retail added +22k. Outside that bucket, the rest of the cyclical private economy added something close to zero. Manufacturing was −2k. Financial activities was −11k. Information was −13k and is now down 342,000 from its November 2022 peak. Federal payrolls fell another 9k and are down 348,000, or 11.5 percent, from October 2024. The diffusion index for total private payrolls fell to 53.8 from 56.8 in March, and manufacturing diffusion dropped back below 50 to 47.2, meaning more manufacturing industries shed jobs in April than added them. Health care has no business cycle in the usual sense — the demographic clock runs whether GDP grows at 1 percent or 4. Education behaves similarly. These are sectors that put a floor under the unemployment rate without telling you much about whether the cyclical economy is hiring.
The participation story is the more important one, and it is structural. Labor force participation fell to 61.8 percent, the lowest reading since October 2021. The employment‑population ratio fell to 59.1 percent. The civilian labor force shrank 92,000 on the month and roughly 1.06 million over the year against a noninstitutional population that grew 1.76 million. None of that is a demand problem. The unemployment rate is steady because workers are leaving the labor force, not because the economy is absorbing them. Foreign‑born participation has also turned, and the immigration policy cycle is a binding constraint that is not going to loosen. The harder question is whether the country has the workers, and the right kind of skilled workers, to fill the jobs that AI infrastructure buildout, reshoring, and the energy transition are going to demand. On the current trajectory the answer is no.
Wage growth is cooling and real wages are running close to zero. Average hourly earnings rose 0.2 percent on the month and 3.6 percent year‑on‑year. March was revised down to 3.4 percent from 3.5 percent; February ran at 3.8 percent. Year‑on‑year nominal wage growth has shed roughly 40 basis points since the start of 2026. On the BLS’s CPI‑U real‑wage measure, March showed real average hourly earnings up just 0.3 percent year‑on‑year — the slimmest real‑wage gain in over a year. April CPI lands next week and is widely expected to print hot on the back of the Iran‑related energy impulse and continuing tariff pass‑through, which will compress real wages further before it expands them. The production and non‑supervisory print was a touch better at 0.3 percent on the month, but that is not enough to change the picture: the worker has very little real pricing power left.
There are cracks underneath the unemployment rate that the headline does not show. Part‑time for economic reasons jumped 445,000 to 4.9 million. U‑6 rose to 8.2 percent from 8.0 percent. The number unemployed less than five weeks rose 358,000 — those are fresh job losses, not stale ones. Long‑term unemployed are still a quarter of the unemployed pool. Job losers and people who completed temporary jobs ticked up 108,000 to 3.51 million. None of this is a labor market that is breaking. It is a labor market in which the marginal worker is steadily losing ground.
Consumption is being held up by a three‑part bridge, and the bridge is getting brittle. March nominal PCE rose 0.9 percent and real PCE rose just 0.2 percent — the gap is the inflation pulse, mostly energy with a tariff component. Disposable personal income rose 0.6 percent in nominal terms and was actually down 0.1 percent in real terms. With outlays running well ahead of income, the personal saving rate fell to 3.6 percent from 3.9 percent in February and 4.5 percent in January, the lowest reading since October 2022. Personal saving in dollar terms has fallen to $857.3 billion from $1.05 trillion at the start of the year. Consumer credit picked up the slack: Q1 2026 total consumer credit grew at a 3.2 percent annualized rate, but March alone ran at 5.8 percent annualized, with revolving credit — credit cards — jumping at 9.1 percent annualized after running near flat in February. That is one of the strongest revolving prints since 2022. Households are not strapped, but they are increasingly funding current consumption out of accumulated savings and incremental borrowing. That works in a soft‑landing scenario. It gets reflexively worse if the labor market wobbles or inflation pushes higher.
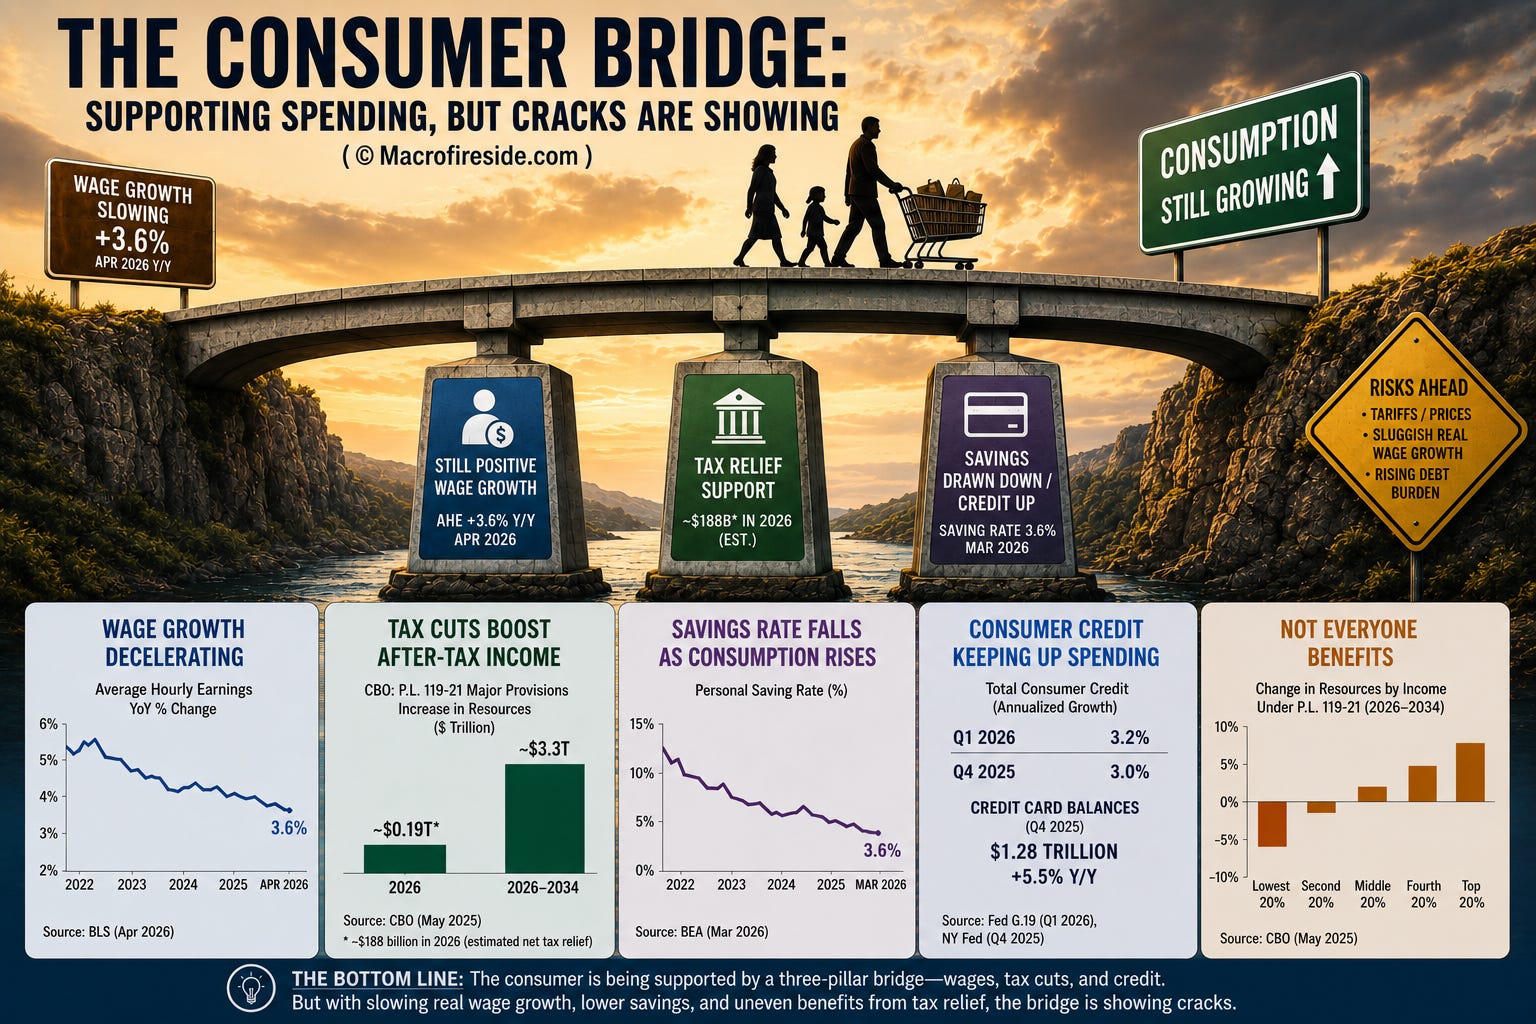
The third leg of the bridge is fiscal, and it is skewed. The 2025 reconciliation act (P.L. 119‑21, signed July 4, 2025) is providing a real after‑tax‑income tailwind, but how the tailwind is distributed matters as much as its size. The CBO’s August 2025 distributional analysis estimates that over 2026–2034, federal taxes and cash transfers will add roughly $3.3 trillion to household resources in 2025 dollars, while federal and state in‑kind transfers — mostly Medicaid and SNAP — will subtract roughly $900 billion. The net is positive on average. The CBO is also explicit that resources fall for households at the bottom of the income distribution and rise for households in the middle and at the top: subsequent analysis put the top decile up about 2.7 percent in income by 2034 and the bottom decile down about 3.1 percent. Marginal propensity to consume falls with income, so a dollar added at the top is partly saved or invested while a dollar removed at the bottom is consumption foregone with no offset. Tariff pass‑through compounds the squeeze on the lower‑quintile cohorts because tariffs operate as a regressive consumption tax. The consumer is not broken — but consumption breadth is narrowing, and the cohorts most exposed to a labor‑market wobble are the same ones already drawing down savings and leaning harder on the credit card.
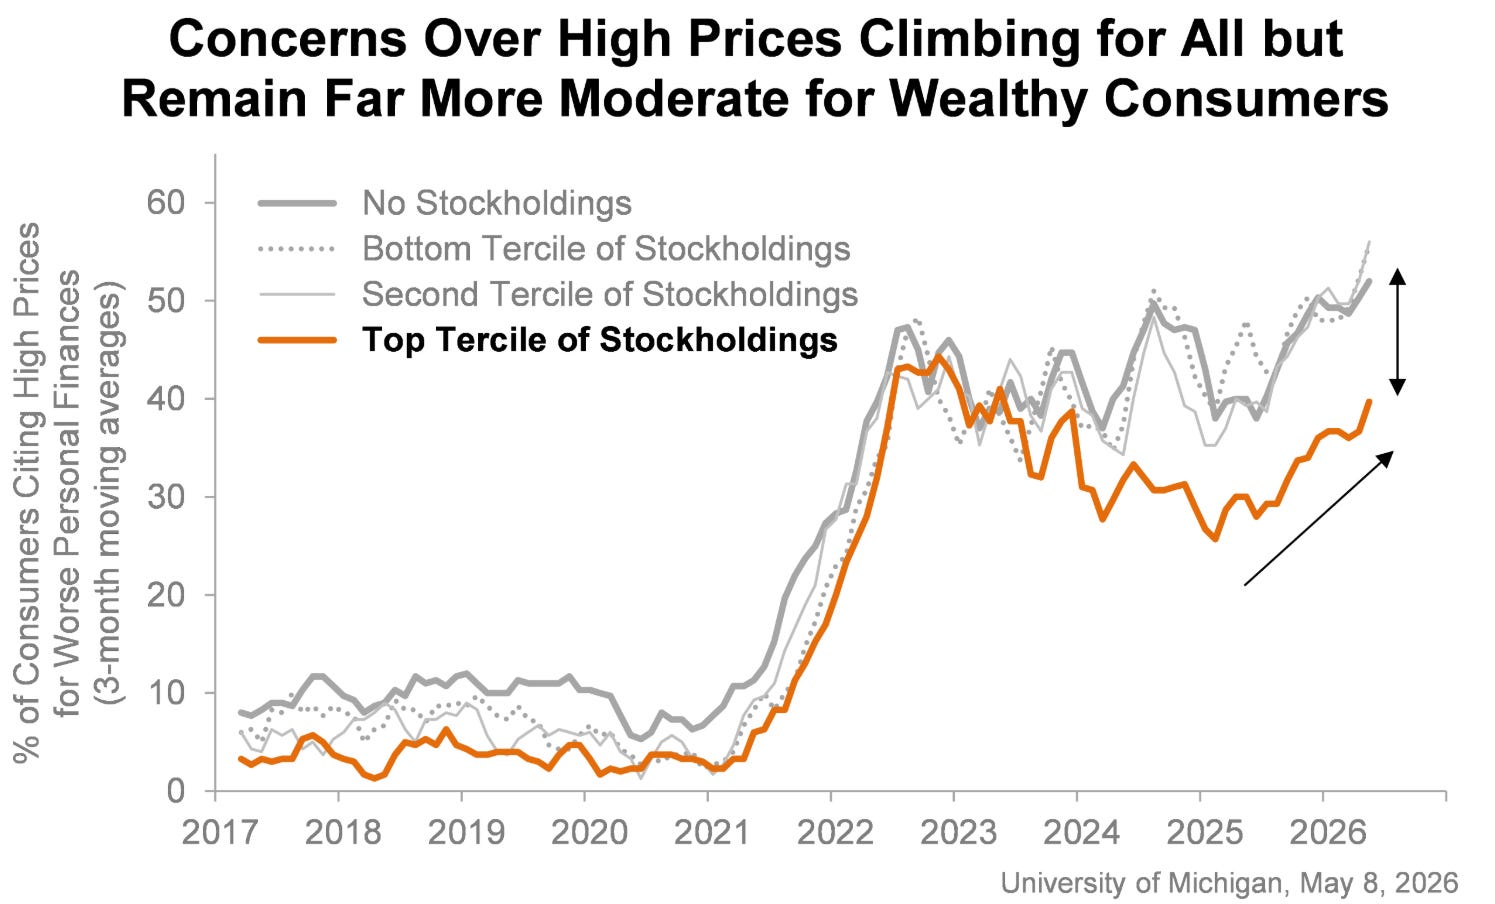
And consumer confidence is not holding. An hour and a half after the payrolls release, the University of Michigan preliminary May sentiment reading came in at 48.2, down 1.6 points from April’s 49.8 and back to the June 2022 trough. Current Economic Conditions fell sharply to 47.8, down 9.0 percent on the month and 18.8 percent year‑on‑year. The Expectations Index barely moved at 48.5, suggesting consumers see the present as weaker than they previously thought rather than the future as worse. About a third of respondents spontaneously mentioned gasoline prices and roughly 30 percent mentioned tariffs — the same Iran energy impulse and trade pass‑through that show up in the inflation gauges and the wage gap. Real income expectations have been declining since March. The inflation expectations component is the part that should worry the Fed most: year‑ahead expectations softened a touch to 4.5 percent from 4.7 percent in April but remain well above the pre‑war 3.4 percent reading and the 2.3–3.0 percent range that prevailed in 2019–2020, while long‑run expectations sit at 3.4 percent against a 2024 range of 2.8–3.2 percent. Sentiment is a leading indicator of consumption, and the bridge described above only holds if households are willing to keep spending while drawing down savings. A sentiment print at the June 2022 trough on the same day the headline payrolls number printed Goldilocks is a real tension. The two reports describe the same economy from opposite sides of the same coin.
The corporate signal underneath the data is shifting, and it is sectorally concentrated. After Thursday’s close alone, BILL announced cuts of up to 30 percent of its workforce, Cloudflare cut roughly 1,100 jobs (about 20 percent of its 5,156‑person base), and Upwork cut roughly a quarter of its staff. Coinbase announced a 14 percent reduction earlier in the week, framed explicitly as a shift to an AI‑native operating model. Freshworks cut 500 jobs the day before that, with the CEO telling Reuters that more than half the company’s code is now written by AI. PayPal has disclosed plans to cut about 20 percent of its 23,800‑person workforce over two to three years. Meta has 8,000 cuts scheduled for May with capex guidance raised to $125–$145 billion. Amazon has shed roughly 30,000 in the last five months, Oracle is in the middle of an estimated 30,000‑person reduction, and Microsoft has lost about 125,000 through what the company calls voluntary departures.
Notice what is on the list and what is not. The cuts are clustered in tech, fintech, IT services, knowledge‑work platforms, and white‑collar professional services — the sectors where output is code, contracts, models, and decisions, and where an LLM at the desktop can do meaningful displacement. Construction is not on the list. Healthcare is not on the list. Hospitality, transportation, manufacturing, retail — none of those are on the list. The plumber, the nurse, the warehouse worker, the line cook are not getting AI‑substituted in 2026, and probably not in 2027 either. Two consequences follow. The productivity story implicitly priced into long‑duration risk assets requires gains in the substitutable sectors to flow through to the rest of the economy, and that flow‑through is not visible yet and will take years. Separately, the sectors getting cut are the ones that historically generated the highest‑paid jobs and the largest tax base. Replacing a $300,000 software engineer with $50,000 of GPU time is a margin event for the firm and a tax‑base event for the public sector — and an aggregate‑demand event for the consumption profile of the upper‑middle quintile, which is the cohort that, until now, has not been the one drawing down savings.
Where does this leave the Fed? I cannot find a case for cutting in this report or the surrounding data. Core PCE is at 3.2 percent, headline at 3.5 percent. Trimmed mean PCE — the gauge Chair‑designate Warsh has flagged as his preferred read — has stopped falling and sits at 2.4 percent against a 2 percent target, with skewness in the price‑change distribution suggesting tariffs are pulling component prices upward in ways trimmed measures partly mask. Inflation has been at or above target for five consecutive years and has accelerated for four straight months across most major gauges. Michigan year‑ahead inflation expectations at 4.5 percent and long‑run at 3.4 percent are the kind of unanchoring that puts a hawkish constraint on any FOMC member who takes the Fed’s credibility seriously. April CPI is widely expected to print hot. Growth risks remain tilted to the upside relative to the soft‑landing baseline because the AI‑capex impulse and the fiscal trajectory are both running hot. The 8‑4 hold‑rates vote at the April 29 meeting was the most dissents at the FOMC since 1992. Three of the four dissenters specifically opposed the easing‑bias language. CME FedWatch has the odds of a 2026 hike at roughly 17 percent and the odds of a cut at roughly 13 percent — a slight tilt toward a hike, not a cut. The market is essentially priced for no funds‑rate movement over the next twelve months, which is the right starting point given the data. The asymmetric risk is that the next surprise is a hawkish guidance shift rather than a dovish cut, and the new Chair will be tested by a market that has already partially priced an easing path the data have not delivered.
The April number was not bad. It was just not the report the tape said it was. A cyclical economy held up by acyclical hiring is not the same thing as a strong labor market. A participation rate at a four‑year low is a structural constraint, and rate cuts do not fix structural constraints. A consumer financing today’s spending out of a saving rate at 2022 lows and revolving credit running at 9 percent annualized, with sentiment back at the June 2022 trough and inflation expectations unanchored, is one bad print away from a real slowdown in services. The AI‑driven labor substitution underway in tech and finance is real, and it is also narrow — too narrow to lift aggregate productivity to the four‑percent or higher GDP prints the most aggressive equity narratives need. Long‑duration assets pricing aggressive easing into 2026 are pricing a Fed that this report does not justify. The curve, the dollar, and the front end of rates are where the disagreement gets resolved.
Read the body of the report, not the press release.
Sources: U.S. Bureau of Labor Statistics, Employment Situation, April 2026 (USDL‑26‑0687); BLS Real Earnings, March 2026; BEA Personal Income and Outlays, March 2026; Federal Reserve G.19 Consumer Credit, March 2026; Federal Reserve Bank of Dallas Trimmed Mean PCE; University of Michigan Surveys of Consumers, Preliminary May 2026 (released May 8); Congressional Budget Office, Distributional Effects of P.L. 119‑21 (August 2025); CME FedWatch; company filings and announcements.
The Macro Fireside
Macrofireside.com · @Macrofireside on X
The Macro Fireside is a practitioner’s publication — written at the intersection of markets, policy, and geopolitics by an experienced hand who has spent decades managing money through moments the world would only later recognize as inflection points. Analysis here is earned, not assembled. This piece does not constitute investment advice.
For professional enquiries: gs@macrofireside.com