
Caution: Dollar Ahead! — Part 2 of 4: Cross-Asset Implications of Dollar Weakness
Four catalysts since January 26 have deepened the thesis. Here is where to act across equities, credit, rates, FX, and commodities.

Executive Summary
The US Dollar, having printed its recent cycle high almost exactly a year ago, is transitioning toward a more neutral — and potentially weakening — phase. DXY has already declined by about 12% from its January 2025 cycle peak of 110.18 to under 98. It is poised to go lower, as I had argued in Part 1. Four recent developments have reinforced, not challenged, the original thesis.
The cross-asset implications point toward a measured repositioning, not a structural exit: moderating the US equity overweight, adding selective EM credit and non-US equity exposure, maintaining real-asset allocations, and positioning for a modest steepening environment. These cycles reward patience over precision.
This is not an anti-US view. It is a pro-diversification one. US assets can continue to perform, but the environment increasingly favors broader participation across regions and asset classes — and portfolios that reflect that shift.
What Has Changed Since January 26
Four developments since the original publication have each independently strengthened the case for sustained dollar weakness:
Kevin Warsh (Fed Chair Nominee, Jan 30): Despite his hawkish reputation, Warsh’s current posture favors near-term rate cuts anchored to a productivity-driven view of AI. His QT hawkishness steepens the curve — consistent with our base case. The structural read: a Fed pursuing front-loaded easing while shrinking its balance sheet implies real-rate compression and medium-term dollar depreciation. Confirmation remains uncertain, with Senate complications. But the market’s initial read was wrong — this is an easing signal dressed in hawkish clothing.
Mag-7 AI Capex (~$650-680B in 2026): Q4 earnings confirmed a historic spending surge — Amazon $200B, Alphabet $175-185B, Meta $115-135B, Microsoft ~$144B annualized. Free-cash-flow compression is beginning to erode the US earnings premium that sustained dollar strength. Critically, this is also a physical commodity story the market has not fully priced: copper for data center cooling, aluminum, rare earths — new demand layered on top of electrification and strategic stockpiling.
SCOTUS IEEPA Ruling (Feb 20, 6-3): The Court struck down IEEPA-based tariffs, vacating the Liberation Day levies and creating $130-175B in potential refunds. Trump responded with a Section 122 global tariff capped at 15% for 150 days. The net effect: the tariff-as-fiscal-revenue narrative is broken, deepening the US fiscal deterioration thesis and removing a structural pillar of dollar support. Trade policy uncertainty persists, but the aggressive posture has been constitutionally constrained.
US-Iran Escalation: IRGC maritime provocations in the Strait of Hormuz, a US carrier buildup, tanker seizures near Farsi Island, and stalled nuclear talks have materially raised the geopolitical risk premium in energy. An Axios analysis dated February 18 characterized military conflict as more likely than not absent a breakthrough. This adds a real supply disruption overlay — not yet fully priced — that compounds the commodity impact of a weaker dollar.
Introduction
The dollar is no longer just expensive — it is gradually losing the macro pillars that sustained its decade-long dominance. Part 1 outlined the structural drivers behind a potential multi-year depreciation cycle. The relevant question is how that shift transmits across asset classes and reshapes portfolio construction over a 12–24-month horizon.
Dollar downcycles historically coincide with broader global participation in risk assets, improved financial conditions outside the US, and stronger performance from real assets. The implication is not that US markets must weaken, but that leadership becomes less concentrated.
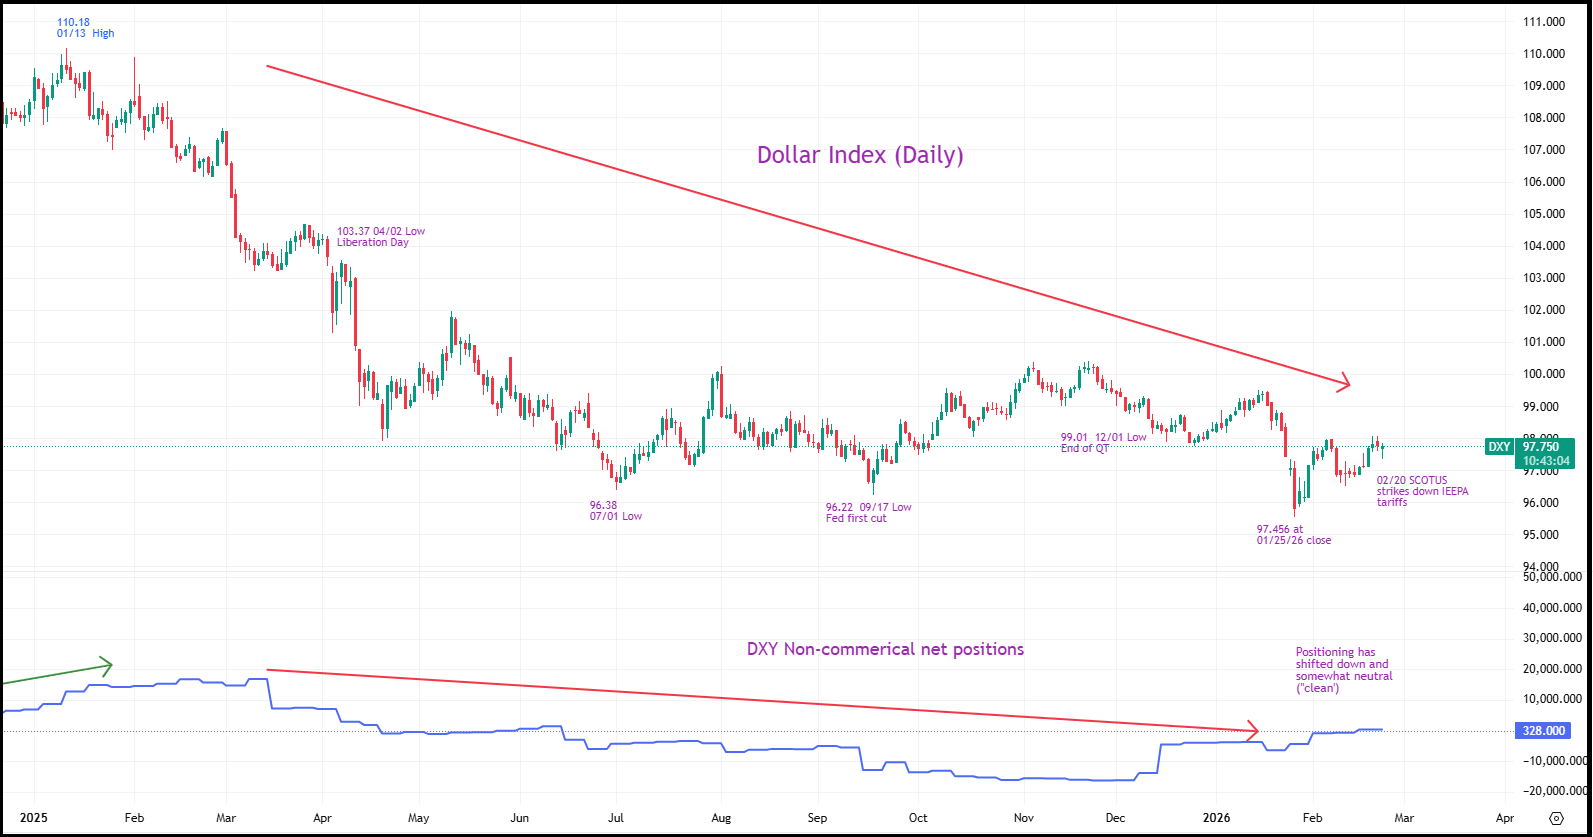
(Courtesy: TradingView)
Equities — From Concentration to Breadth
For much of the past decade, US equities benefited from a reinforcing loop of superior earnings growth, multiple expansion, and dollar strength. As that loop loosens, leadership is likely to broaden.
The valuation gap remains stark: S&P 500 forward P/E at approximately 22x against roughly 15x for MSCI EAFE — a spread that persists despite EAFE outperforming the S&P 500 by double digits in 2025. A 10% dollar-decline translates to approximately 200-300bps of EPS upside for US multinationals, while non-US companies benefit more directly as local-currency earnings are amplified in dollar terms.
The AI capex cycle has introduced a meaningful intra-sector dynamic. Markets are now differentiating sharply: companies where AI monetization is visible are rewarded; those spending aggressively without clear near-term returns are penalized. This discriminating market for US tech is the early signature of premium erosion — precisely the kind of transition that historically marks a turn in US equity leadership relative to non-US markets.
The portfolio implication: reduce the assumption that US equities must dominate returns. Moving from 65-70% US exposure toward 50-55%, with EM and Europe increasing to 30-35% combined, is a measured repositioning — not a structural exit from US markets.
Credit — The Balance-Sheet Channel
Currency regimes transmit quickly into credit markets. Dollar weakness typically eases external financing conditions, lowers refinancing risk, and supports spread compression — particularly across emerging markets with credible policy frameworks.
With US investment-grade spreads currently around 80-90bps OAS — near multi-year tights — compression room is limited and the asymmetry increasingly lies elsewhere. Local currency EM debt yields 6-8% with inflation cooling across major markets; hard-currency EM sovereign debt yields 7-10%, with spreads that compress materially in dollar downturns. At 6-8% running yield, EM debt compensates adequately for volatility even before currency appreciation. The 12-15% total return scenario rests on three components working together: 6-8% running yield, 3-4% spread compression as dollar weakness eases EM external financing conditions, and 2-4% FX tailwind as EM currencies recover.
The SCOTUS ruling has a specific credit implication: $130-175B in potential tariff refunds deepens the US fiscal deterioration trajectory, widening deficits and adding to long-term headwinds for dollar reserve demand — the structural backdrop that makes EM credit more attractive relative to US investment grade. Risk management requires differentiation: focus on investment-grade or near-IG sovereigns (Chile, Peru, Poland) and EM corporates with improving cash flow and local-currency revenue streams.
Rates — Steepening Underway, Warsh Adds Texture
A policy mix of gradual easing alongside persistent fiscal supply points to a modest steepening bias over time. Front-end yields respond to policy; the long end reflects growth uncertainty and term premia. Duration diversification tends to be more effective than concentrated directional bets in this environment.
The current picture is already consistent with early steepening: the 10-year Treasury at 4.08%, the 2-year at 3.48%, and the 2s10s spread at 60bps — up materially from the compressed levels earlier this year. The 30-year at 4.72% reflects a persistent fiscal supply premium. Fed funds at 3.50-3.75% leaves meaningful room to cut toward the 3.00-3.25% range that most research desks identify as neutral, with markets pricing approximately 50bps of additional easing through year-end.
Warsh adds texture but not contradiction. His combination of near-term easing preference and QT hawkishness — cut rates while shrinking the balance sheet — does not produce straightforward dollar weakness, but it does support further curve steepening. A further move toward 75-100bps on the 2s10s over 12-18 months remains a reasonable target, particularly as front-end cuts arrive before the long end fully reprices the inflation risk embedded in energy markets and fiscal dynamics.
The medium-term dollar depreciation path depends less on any single Fed action than on two forces that persist regardless of Warsh’s specific policy mix: the widening growth differential between a recovering Europe and a slowing US, and the structural re-diversification of reserve assets away from dollars. Those dynamics are what sustain the EUR/USD trajectory toward 1.20-1.25 — even if the path proves non-linear.
The key r* question: if AI productivity materializes at scale, the true neutral rate is likely lower than current Fed estimates, extending the cutting cycle further than currently priced. Under a Warsh chairmanship that accepts this framework, the easing path could extend well into 2027.
FX — Core Expressions
EUR/USD is already trading near 1.18, having gained roughly 13% against the dollar over 2025 and briefly touching a four-year high of 1.2019 on January 27. The structural target of 1.20-1.25 over the 12–18-month horizon — supported by the Eurozone’s current account surplus, relative valuation, and the narrowing US-ECB rate differential (Fed at 3.50-3.75%, ECB on hold at 2.00%) — is now materially closer to current levels. Bank consensus clusters around that range by year-end; Goldman targets 1.25. The SCOTUS ruling, by reducing tariff pressure on EU exports, is incrementally euro-positive.
Select carry trades can add incremental return potential but should remain tactical. Brazilian real and South African rand offer 10-14% nominal yields with commodity tailwinds; sizing at 1-2% of portfolio with options-based downside protection is appropriate given volatility. Asian currencies — Korean won, Taiwan dollar, Singapore dollar — are structural beneficiaries best accessed through equity exposure rather than direct FX positions.
Commodities — Cyclical, Structural, and Now Geopolitical
Commodity strength in this cycle is not purely a currency story. Structural demand linked to infrastructure, electrification, and supply constraints provides a tailwind — and the AI infrastructure buildout adds a physical demand story the market has not fully priced across copper, aluminum, and rare earths, compounding with dollar weakness.
Gold has moved decisively, trading near $5,100/oz as of this writing — up from approximately $2,900 a year ago. JPMorgan’s target of $5,000/oz for Q4 2026 is already effectively in range; the more relevant forward anchor is the path toward $5,500-6,000 under continued real-rate compression. The Warsh-nomination selloff in gold — a sharp decline on perceived hawkishness — was a market overreaction, not a thesis change. Central bank buying running at approximately 850 tonnes annually and accelerating de-dollarization provide a structural floor independent of Fed chair identity.
Energy markets now embed a genuine geopolitical premium. WTI trades near $66/bbl, having rallied from the mid-$50s on Iran risk escalation. Even a diplomatic resolution at this stage would leave an elevated risk premium for months. The mechanical $5-8/barrel WTI tailwind from a 10% DXY decline is now layered on top of real supply disruption risk. OPEC+ supply discipline and US shale maturity provide the structural floor.
Positioning: own gold as the primary commodity allocation (5-10% of portfolio), energy through equities with strong balance sheets and free cash flow, and base metals via diversified miners. The AI capex buildout makes copper particularly well-positioned among base metals.
Portfolio Implications — Gradual Diversification
The cross-asset implications point toward incremental portfolio adjustments rather than abrupt repositioning:
• Reduce structural US equity overweight from 65-70% toward 50-55%; increase EM and Europe to 30-35% combined
• Move EM debt from 0-5% toward 10-15%, split between hard-currency sovereigns and local-currency bonds
• Maintain gold at 5-10% of portfolio; at current levels near $5,100, new positions require more discipline on entry
• Position for continued curve steepening — 2s10s at 60bps has moved in our direction; the base case is a further move toward 75-100bps
• Tactical carry in BRL and ZAR at 1-2% with options-based protection; Asian currency exposure via equity rather than direct FX
DXY is approximately halfway to the structural target of 88-90 from its January 2025 high. The more interesting 8-10 points — from the mid-90s to 88-90 — are where cross-asset correlations historically shift most dramatically. That is where currency weakness stops being a tailwind and becomes a rerating event.
What Could Challenge the Thesis
No macro transition is linear. Dollar strength could reassert on faster-than-expected US productivity gains validating current valuations; safe-haven demand if Iran tensions escalate to outright conflict; or US growth differentials remaining favorable longer than expected. Near-term, the Warsh confirmation uncertainty introduces rate volatility that could temporarily support the dollar. Sizing positions to withstand a DXY bounce toward 100-102 is prudent risk management, not thesis abandonment.
Conclusion — Leadership Broadens
The dollar is in structural transition — from decade-long tailwind to a more neutral and gradually weakening force. The four developments since January 26 have each reinforced this shift: a Fed moving toward easing under new leadership, an AI investment cycle beginning to erode US equity premium while creating physical commodity demand, a constitutionally constrained tariff regime that deepens fiscal deterioration, and an energy market now pricing real supply disruption risk.
As that transition unfolds, global asset leadership is likely to broaden rather than rotate abruptly. The central risk is not volatility itself but concentration — remaining anchored to the leadership regime of the past decade while the opportunity set quietly expands.
Next: Part 3 will focus on implementation — translating the macro framework into specific trade structures, position sizing, and portfolio construction across institutional and individual account types.
Disclaimer
The Macro Fireside is published for informational and educational purposes only. Nothing in this publication constitutes investment advice, a solicitation, or an offer to buy or sell any security, financial instrument, or investment product of any kind. The views expressed are solely those of the author and do not represent the views of any employer, affiliated entity, or counterparty.
All analysis reflects the author’s independent judgment as of the date of publication. Market conditions, data, and regulatory environments change rapidly; no representation is made that any information herein remains current or accurate after the publication date. Past performance of any asset class, strategy, or instrument referenced herein is not indicative of future results.
Readers should conduct their own independent research and due diligence, and consult a qualified financial adviser, attorney, or tax professional before making any investment decision. The author may hold positions in securities or instruments discussed in this publication. Such holdings are subject to change at any time without notice and without obligation to update this publication.
This publication is not directed at, and should not be relied upon by, any person in any jurisdiction where its distribution or use would be contrary to applicable law or regulation. By reading this publication, you acknowledge and agree that the author and The Macro Fireside bear no liability for any investment decisions made in reliance on its contents.