

· macrofireside.com · November 3, 2026
Written on midterm Election Day, the day before the Quarterly Refunding Announcement.
The 1990s DC gridlock trade worked because the compromises of that decade shrank the deficit. The compromise reflex is still intact, but these days it adds to issuance. With Treasury estimating $800 billion borrowing for the first quarter of 2027, and hyperscalers and other capex borrowers raising hundreds of billions in the same window, the long end will take its cue from that supply long after the midterm count is settled.
The argument from the time capsule
This morning, with the midterm polls open, a rates strategist on television recycled the case that a split Congress is good for Treasuries. His chain ran as it did in 1994, from gridlock to no spending bills to less issuance to higher bond prices. He sounded certain, but his call was for a mere 20bp rally in the 10-year, which in itself is not saying much. The old rubric he was using stopped working a while ago. A divided Congress has become the routine midterm result, since the president’s party usually loses seats. His argument needs a structural shock but sadly lacks one.
There is a stronger version of the case, and it skips supply. Gridlock lowers the odds of a new tax package or another round of fiscal shocks, and the term premium has fewer surprises to absorb. That would carry weight if the deficit path and the auction calendar were still open. But they are set, and a divided Congress brings its own debt-ceiling standoffs and shutdown deadlines.
What the compromise used to buy
The deals of 1995 through 1997 reduced the deficit, and bonds rallied into shrinking supply and an easing Fed. The shutdowns along the way did not change that. The compromise reflex survives. Spending has become bipartisan time and again, the two sides always find a number, and that number now adds to borrowing. The same political mechanism that cut issuance thirty years ago expands it today. That is the history the gridlock thesis leaves out. The debt ceiling chart below is the record: $4.9 trillion in 1995 to $41.1 trillion today, and every standoff has ended in a higher limit or a suspension.
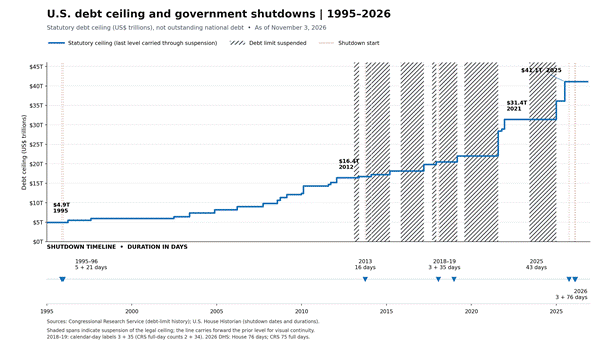
Exhibit 1. The statutory debt ceiling and government shutdowns, 1995 to 2026.
Sources: Congressional Research Service; U.S. House of Representatives.
Supply does not care who holds the gavel
Monday’s Treasury financing estimates, released ahead of Wednesday’s refunding, put privately held net marketable borrowing at $800 billion for the January to March 2027 quarter. Part of that is cash build. Treasury assumes an end-March cash balance of $1 trillion against $850 billion at year-end, so roughly $150 billion goes into the Treasury account and finances no deficit. Strip it out and the quarter still runs near $650 billion against the $577 billion actually borrowed a year earlier, a rise on the order of 13 percent with no new spending bill behind it. The current quarter was trimmed by $10 billion from the August estimate, and that is the only braking on display. Nothing on today’s ballot changes the size of next quarter’s auctions.
The other borrowers
The government is no longer the only large bidder for long-term money. The hyperscalers have moved from funding capex out of cash flow to funding it in the bond market. The five of them issued roughly $121 billion bonds in 2025, four times their prior five-year average. BofA’s forecast for 2026 went from $140 billion in January to $175 billion in March, and by August JPMorgan had the year’s hyperscaler debt near $317 billion, with data center project finance on top. Each estimate has been overtaken by the next, and spreads on some of that paper widened as the market absorbed unexpected supply over the summer. For Treasuries the issue is competition for duration. A private sector raising hundreds of billions for data centers and the power to run them is a rival supplier of duration in maturities close to the ones Treasury sells, and gridlock in Washington does nothing to reduce it.
The floor under the long end
If the capex boom delivers the productivity it promises, the neutral rate would rise with it, and higher trend growth would mean structurally higher long-term yields. That being said, productivity gains also restrain inflation, which limits how far that pushes the long end without changing the direction. The end of hyper-globalization too pushes it the same way. The 1980s and 1990s suppressed inflation and yields through the cheapest supply chains the world had seen. Reshoring, near-shoring, and supply chain duplication raise input costs by design. None of this shows up on a fiscal spreadsheet, and a change of committee chairs does not reverse any of it.
What it means for the book
The gridlock trade depends on a mechanism that has not operated in this cycle, so the burden of proof sits with anyone proposing to pay for it. I am not positioned for a supply-driven rally in the long end on the election result. If one arrives, I will use it to reassess duration before adding any. In this context, Wednesday’s refunding carries more information than today’s vote count. The coupon sizes and the bill share would show how the $800 billion gets financed, and the long end prices off that. The old playbook that priced a split Congress thirty years ago describes a world with a shrinking deficit and a globalizing supply chain. Citing it now is trading a textbook rather than the tape.
Disclaimer
The Macro Fireside is published for informational and educational purposes only. Nothing in this publication constitutes investment advice, a solicitation, or an offer to buy or sell any security, financial instrument, or investment product of any kind. The views expressed are solely those of the author and do not represent the views of any employer, affiliated entity, or counterparty.
All analysis reflects the author’s independent judgment as of the date of publication. Market conditions, data, and regulatory environments change rapidly; no representation is made that any information herein remains current or accurate after the publication date. Past performance of any asset class, strategy, or instrument referenced herein is not indicative of future results.
Readers should conduct their own independent research and due diligence, and consult a qualified financial adviser, attorney, or tax professional before making any investment decision. The author may hold positions in securities or instruments discussed in this publication. Such holdings are subject to change at any time without notice and without obligation to update this publication.
This publication is not directed at, and should not be relied upon by, any person in any jurisdiction where its distribution or use would be contrary to applicable law or regulation. By reading this publication, you acknowledge and agree that the author and The Macro Fireside bear no liability for any investment decisions made in reliance on its contents.
Sources & References
U.S. Department of the Treasury, Office of Debt Management, quarterly borrowing estimates. Reuters. BofA Global Research, research commentary. JPMorgan, research commentary. Bloomberg. Congressional Research Service. U.S. House of Representatives.